
Pythonのmatplotlibを使って散布図を描く方法についてまとめました。
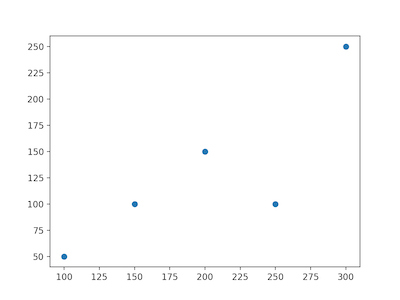
通常
import matplotlib.pyplot as plt
x = [100, 200, 300, 250, 150]
y = [50, 150, 250, 100, 100]
plt.scatter(x, y)
plt.show()
x = [100, 200, 300, 250, 150]
y = [50, 150, 250, 100, 100]
plt.scatter(x, y)
plt.show()
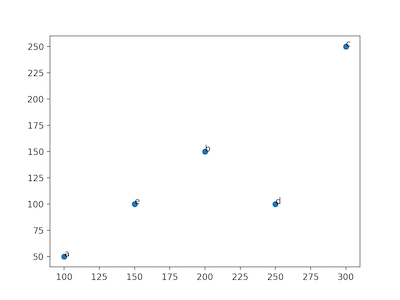
テキスト
import matplotlib.pyplot as plt
x = [100, 200, 300, 250, 150]
y = [50, 150, 250, 100, 100]
texts = ["a", "b", "c", "d", "e"]
plt.scatter(x, y)
for i, text in enumerate(texts):
plt.text(x[i], y[i], text)
plt.show()
x = [100, 200, 300, 250, 150]
y = [50, 150, 250, 100, 100]
texts = ["a", "b", "c", "d", "e"]
plt.scatter(x, y)
for i, text in enumerate(texts):
plt.text(x[i], y[i], text)
plt.show()
テキストが重なる場合
import matplotlib.pyplot as plt
x = [10, 15, 40, 45]
y = [50, 50, 20, 20]
words = ["ASDFGHJKL", "BNM", "CVBNMCVBNM", "DFGHJKL"]
plt.scatter(x, y)
texts = [plt.text(x[i], y[i], words[i]) for i in range(len(words))]
plt.show()
x = [10, 15, 40, 45]
y = [50, 50, 20, 20]
words = ["ASDFGHJKL", "BNM", "CVBNMCVBNM", "DFGHJKL"]
plt.scatter(x, y)
texts = [plt.text(x[i], y[i], words[i]) for i in range(len(words))]
plt.show()
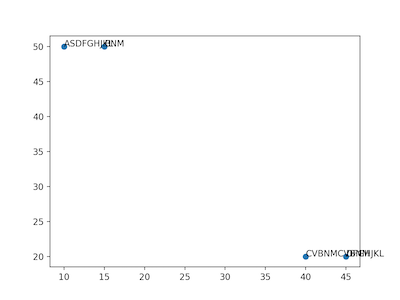
上の通りテキストが長いと重なることがあります。
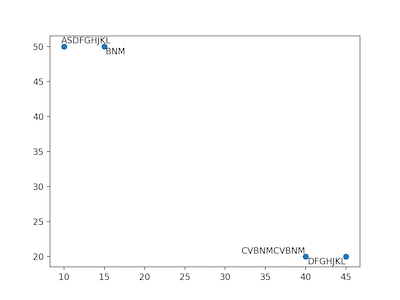
この場合はadjusttextを使うと便利です。
$ pip install adjusttext
でインストールします。
import matplotlib.pyplot as plt
from adjustText import adjust_text
x = [10, 15, 40, 45]
y = [50, 50, 20, 20]
words = ["ASDFGHJKL", "BNM", "CVBNMCVBNM", "DFGHJKL"]
plt.scatter(x, y)
texts = [plt.text(x[i], y[i], words[i]) for i in range(len(words))]
adjust_text(texts)
# adjust_text(texts, arrowprops=dict(arrowstyle='->', color='red'))
plt.show()

コメント